West Bay Sea Swimming
reading surf forecasts
reading surf forecasts
Many different factors affect the state of the sea: wave direction, wave height, wave period, wind direction, wind speed, tide times etc.
The condition of the sea at any given time, will be a result of all these components coming together and acting upon each other.

It may all seem like a lot to know about if you are only thinking about a bob on a summers day, but the sea does need to be taken seriously, especially if you are a year-round swimmer. Also, It’s all interesting stuff, and with a little bit of understanding and practice, reading a forecast should come as naturally as reading your watch.
You can find all this information on surf forecasts sites and apps, so it is worth finding a forecast you like and trust, bookmarking it, and getting used to it. You can find a list of some sea forecast resources on the links page.
wave direction

The prevailing wave direction in West Bay is south-west (SW) or south-south-west (SSW).
As the diagram attempts to show, when waves are coming from the usual SW or SSW direction- then the eastern pier wall offers East Beach some degree of protection. It is this that makes that corner on East Beach the choice of regular, and especially regular winter swimmers.

Obviously, the waves don’t always oblige by coming from the same direction. If they are coming from the east, then instead of being protected, East Beach faces the waves full on.
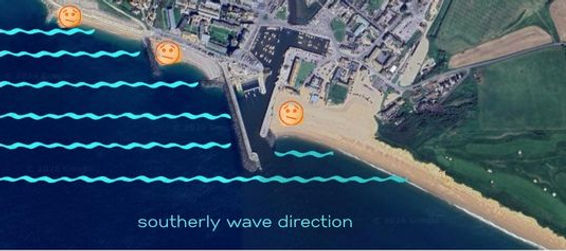
And if large waves are riding in from the south, then all three beaches can be exposed.
If you check the surf forecasts for wave direction, but find it hard to remember how the direction arrow relates to the beach, it may help to try and imagine the pier wall down the left hand side of the forecast chart. Then you can see whether the wave direction arrow is aiming into, or out of the corner.
In this (Met Office) example, the waves are heading away from the corner in the morning, hurrah, but over the course of a few hours, are forecast to change direction and head right into the corner, boo. This is a shift from south westerly waves to south easterly waves.
They are also getting larger.

This is a good example of why it is worth knowing this stuff, as it is worth being aware that the wave direction and height can change quickly, and may even change during your swim.
wave height
Figures for wave height can also be found on surf forecasts. The height figure on those charts does not indicate the height the wave will be on the beach, but it is very a useful aid to gauge whether the sea is likely to be calm, wild, or somewhere in between.
If looked at regularly, you’ll get a good idea of whether it might be worth heading for a swim, or whether you may as well stay at home and make a cuppa.

Roughly, (as all the other factors being discussed here will together determine the state of the sea), in West Bay:
a height of up to 0.3 meters indicates a relatively flat sea,
a height of 0.4m to 1m may, depending on wave direction & wave period, be either perfectly lovely to swim in, or nicely bouncy, or quite rough.
A reading of anything over 1m should be taken even more seriously.
You will need to take the other wind and wave factors into consideration, alongside your own swimming experience and ability.
Wave height can also change over the course of a swim, so again, by checking the forecast first, you will be aware if the sea might be getting bigger. Look at the overall trend forecasted for the day.
wave period
The other important factor that will affect the condition of the sea is the wave period- that is, the time in seconds between waves. Or just think of the time between the crest of one wave and the crest of the following wave.
Why does that matter? Well, because the more time there is between waves, the more time there is for each wave to build up energy and strength. So a larger period figure corresponds to a larger time between waves, which means that there is more force behind the waves.
Conversely, if there is only a short period - i.e. the waves are coming in close behind one another, they will not have the same sort of power or energy.

A smaller wave with a large period, can have more power than a larger wave with a short period, which is why the wave height figure alone is not enough to gauge whether the sea will be safe for your swim.
In West Bay for example:
a wave height of .5m with a low period of 2 or 3, (close together waves) may mean a fun bouncy sea, whereas the exact same wave height of .5m but with a larger period of 15, may well be strong enough to knock you over.
Be aware that a strong spaced apart wave coming in, can often mean there is a strong pull-back or drag when it is going out.
If the beach is sloping or shelving, as East Beach can be, this drag can make it more difficult to exit the sea, or to get out quickly before the next breaking wave.

However a large period isn’t always a bad thing: a large period combined with a not overly large wave height on a flat or gently sloping beach, can result in well defined, well-spaced apart waves that make for fun jumping and shrieking sessions- a scenario that sometimes suits West beach more than East beach, and that often makes for a great time at Lyme Regis.
wind direction and speed
Okay, on to wind direction and wind speed, which obviously also affect the sea conditions. A stronger wind can create a rougher sea, a medium strength wind may make a choppy sea- but it is possibly more important first to be aware of the wind direction than the wind speed.
This is where you have to be aware of off-shore, on-shore or cross-shore winds, as they can shape very different seas.
Hurrah, time for more diagrams!

An off-shore wind blows off the shore and out to sea. There isn’t time, close to the shore, for the wind to whip the waves up, so this can make for calm water that is perfect for swimming close to the beach.

Whereas, if the wind is blowing on-shore, as in from the sea towards the shore, it has plenty of time to push plenty of water towards the beach. The wind speed may be the same in each scenario, but the wind direction will make a notable difference.

In West Bay, the usual wind direction is from the south and the southeast so it is an on-shore wind, i.e. it can push waves towards the beach.
(just to be clear, a southerly wind comes from the south, an easterly wind from the east etc.)


If we get a northerly wind, this blows from the shore in the direction of the sea – i.e it is an offshore wind.
This explains why sometimes here the sea is lovely and flat but there is a bitterly cold wind; the wind has come at us from the north.
An off-shore wind may make for good swimming close to the shore but may also make swimming back to the shore more difficult if you are swimming further out.
Cross-shore winds are when the wind blows along the shore, (not out to sea, and not in from the sea) and if these winds are strong, the waves can become quite choppy and messy. In West Bay, cross-shore winds are those coming from more of a westerly or easterly direction.

Warning: In West Bay, look out for a strong cross-shore easterly wind (i.e. one that is aiming into the corner) combined with strong waves coming from an easterly direction.
Very high energy waves can come from the east /south east during rougher winter weather, which if combined with strong easterly cross-shore winds and strong currents racing out of the harbour mouth can lead to very dangerous sea conditions, with powerful counter currents forming. It is a very hazardous combination.
Stand - stare - then stay aware! weigh up all the factors, and then remain vigilant while swimming, as sea and winds conditions can change very suddenly, especially in bad weather.
wind speed
It’s not necessary to know or remember what each wind speed figure corresponds with what sort of wind blowing, a lot of it is common sense.
But roughly:
a wind speed figure of 1-10 mph is a gentle wind that shouldn’t affect the sea too much,
10 -20mph= moderately windy = large wavelets/small waves,
over 20mph = a strong wind =moderate to large waves,
over 30mph is heading towards a gale = a challenging or forbidding sea.
The state of the sea at each wind speed will differ depending on the wind direction & wave conditions. Again- these are all pieces of the larger picture you are cleverly putting together.
Be aware whether the forecast you are looking at is mph or kp/h.
and be aware of the gust speed as well as the wind speed. In this example, a wind speed of 7mph doesn’t sound too bad, but a gust of 21 is strong enough to matter.

tides and other things
Okay, a last few things that are worth factoring in:
Tide times: be aware if the tide is coming in or going out. The times for high and low tide will be on the surf forecast. On an outgoing tide, it may be harder to get back to shore. A slack tide (an hour either side of high tide or low tide) may make swimming easier, as less water is moving.
Spring tides (have nothing to do with the season) occur every 2 weeks at full and new moon, this is when high tides are higher and low tides are lower. That large difference in water heights will mean more water is moving, so there may be stronger pulls or currents.
Spring tide on surf forecast = large difference in tide heights

Neap tides also occur every 2 weeks, at quarter moons. High tides are lower and low tides are higher than they are on a spring, meaning there is less difference between the height of water at low and at high times. Hence there is less water moving.
Neap tide on surf forecast = smaller difference in tide heights

(Met office examples of wave heights for West Bay)
Temperature: this is a bit of an obvious one, but the colder the sea, the more risk there is of losing energy and getting in trouble. Be aware of your own limits, don’t get carried away swimming on a nice current down towards the cliffs, only to find that it is a harder slog back and the cold is sapping the energy you will need to get back and to exit.
Consider wearing a watch and keeping an eye on how long you have been in the water.
Factor in wind chill on the beach; if you get quite cold in the sea, and then have to change in a biting wind, your body will lose important heat quickly.
Waves can come in sets- unfortunately, not in nicely regular sets that you can count and depend on. You may arrive at the beach and think it is calm and jump on in, but you may well be jumping into a calm period between sets of stronger waves. Stand and stare. The livelier the sea, the longer you should watch.
When you are exiting the sea, also keep an eye behind you on sets or patterns of waves; exiting in a lull is better than being crashed onto shore by a group of more powerful waves.

And after all that;
forecasts are just that,forecasts! Remember nothing beats actually getting to the beach and checking again.
Stand - stare - then stay aware!